30MHz: Smart sensing for horticulture
The more you know, the better (and faster) you can respond to changing circumstances, optimising operations and preventing unnecessary loss.
From cultivation to storage, processing and transport, 30MHz makes it easy for growers to turn data on their crops and environments into better decisions, improving and increasing yield, while reducing costs.
We provide all the elements horticultural businesses need to set up a wireless sensor network and start monitoring their crops in moments, without technical expertise: a combination of rugged sensors designed for protected and outdoor cropping conditions.
Crop analytics at your fingertips
Quick deployment means immediate data, helping horticultural businesses identify opportunities to improve processes and eliminate inefficiencies across contexts.
- Granular, crop-level microclimate monitoring in all types of growing environments, vertical farms and storage facilities.
- Cold-storage monitoring.
- Measuring weather and soil conditions in outdoor crops.
- Remote, global overview of multiple locations on one dashboard.
- Optimising nutrient delivery, irrigation, heating and ventilation.
- Easily sharing selected data in real-time with the supply chain.
- Tracking asset utilisation.
- Tracking and improving transport conditions.
- Demonstrating compliance with easily exportable data & analytics.
A wireless sensor network out of the box
Quick, easy setup in minutes
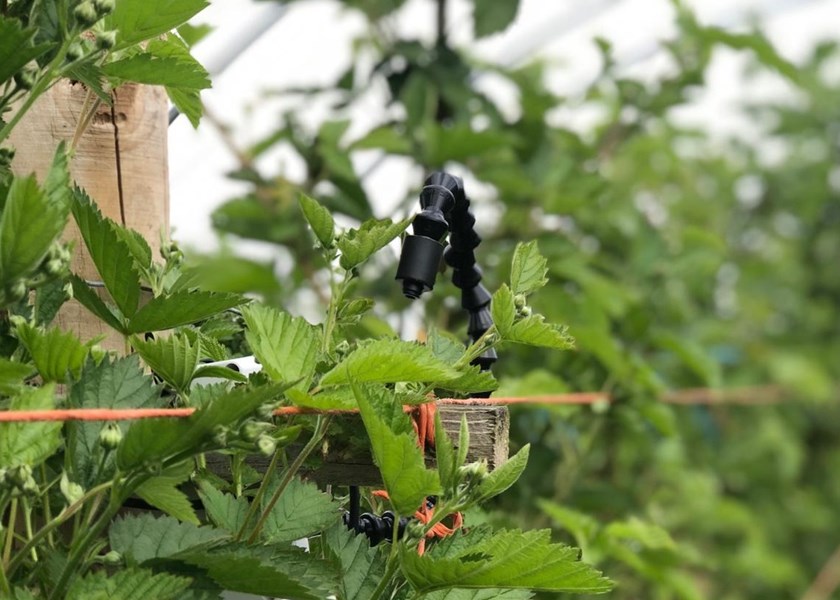
Wireless sensors
Industrial-grade sensors capture any metric, even from the hardest to reach places.
Gateway
Collects sensor data and connects the sensor to the internet.
ZENSIE dashboard
Analytics, alerts and your real-time data. Available on any device, mobile, tablet or desktop.
Metrics that matter
Sourced, developed and tested with leading growers and horticultural research organisations including Wageningen University and Proeftuin Zwaagdijk, 30MHz sensors are made specifically for the needs of modern horticulture.
Designed for accuracy, flawless connectivity and remote placement, these devices are built to withstand the elements in all growing contexts (high levels of humidity, a broad range of temperatures, extreme light intensities) 30MHz customers can choose the combination of sensors that suit their needs, and add new sensors at any time.
Capture and view analytics on metrics includes wind speed, CO2, Plant Object temperature, Wind direction, Vapour pressure deficit, Airflow, Temperature and humidity, Dewpoint, Soil moisture and EC
The data platform for horticulture
Powerful, actionable analytics don’t need to be difficult to use. ZENSIE is intuitive and highly customizable, delivering visualizations and alerts that help smart sensing make sense to the whole team.
There’s no need to juggle multiple interfaces, ZENSIE provides a central location for all horticultural data points, from sensors to climate computers, balancing granular, crop-level insights with macro overviews of environmental conditions. Sensory data your way.
Share sensor insights
Share data from your sensors with third parties. Dashboard social sharing lets you share real-time environment data with your customers or advisers, or view the growing conditions at your other locations or contract growers.
Heatmaps
Used in combination with the image upload feature, heat maps generate colour-coded visualizations of sensor value concentrations, sensor locations or signal strength across photographs, diagrams or maps.
Notifications
Set up custom notifications when sensor values cross certain thresholds, get alerts on uptime and connectivity, and stay up to date on each device’s battery life in real-time with alerts via email, SMS and pop-ups in the ZENSIE dashboard.
A modern, powerful API
Connect data across technologies and see your insights in context. Use the ZENSIE API to bring data captured by your wireless sensors to external applications, integrate third-party data into the ZENSIE dashboard.
Image upload
Make sensor measurements tangible by plotting sensor values onto your choice of images. Visualize sensor readings on maps, diagrams, or photographs.
Calculations
Get more out of your sensor measurements with calculations that deliver new metrics. Use ZENSIE to calculate dew point, vapour pressure deficit, temperature hours, combined utilization and more.
Charts
Track single sensor measurement values or compare metrics with easily customizable graphs and visualizations. Drill down by time frame, location and measurement frequency, and compare locations on a global scale.
Export data
Data is a valuable asset, and we make sure you have full control over who accesses it. Customers are sole proprietors of their sensor data, and can easily download it in CSV format.
Control measuring frequency and billing. Pay only for the measurements you need, by adjusting how you measure with changing contexts. Switch measuring frequency, or pause sensors when you aren’t using them.
Compare locations
Track environments across the globe in a single dashboard. Create custom reports and visualizations based on location, or set one space as a benchmark for comparison.
Crop analytics at your fingertips
The 30MHz architecture is built to extract and manage high volumes of data and scale at any pace with your business.
To ensure the highest level of stability, your sensors deploy to a private network. If one sensor loses connectivity, the rest compensate. This guarantees the network is immune to interruptions.