Using data to optimise IPM and crop health
By Ant Surrage, Fargro Technical Development Manager

By Ant Surrage, Fargro Technical Development Manager
Crop health and protection is vitally important to all growers, data can play an instrumental part in optimising this within an IPM Programme. In this article, we talk about how data can help inform decision making and help manage your IPM programmes more effectively.
"30MHz tech enables us to really understand what each individual crop is doing, and to respond accordingly." - Jonathan Zwinkels, Madestien
Using data to optimise your IPM programme
For example, vine weevil (Otiorhynchus sulcatus) is a key pest in ornamental plant production as well as a range of other crops. Adult vine weevil cut distinctive notches into leaf edges when feeding. Larvae feed on the roots of plants which then has profound effects on the development of the crop and causes serious plant damage. A growers first line of defence in terms of products to apply are nematodes.
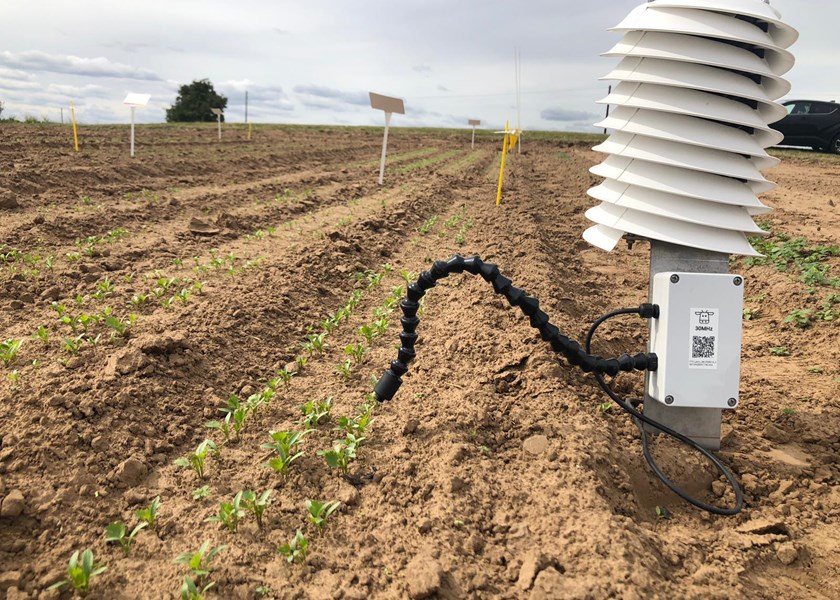
There are two key treatments that are effective on vine weevil, Nemasys-L and Exhibitline Hb. Nemasys-L works down to soil temperatures of 5°C whereas Exhibitline Hb works at soil temperatures above 12°C. Knowing your soil temperature in real-time means growers can make a better-informed decision on which control option to implement.
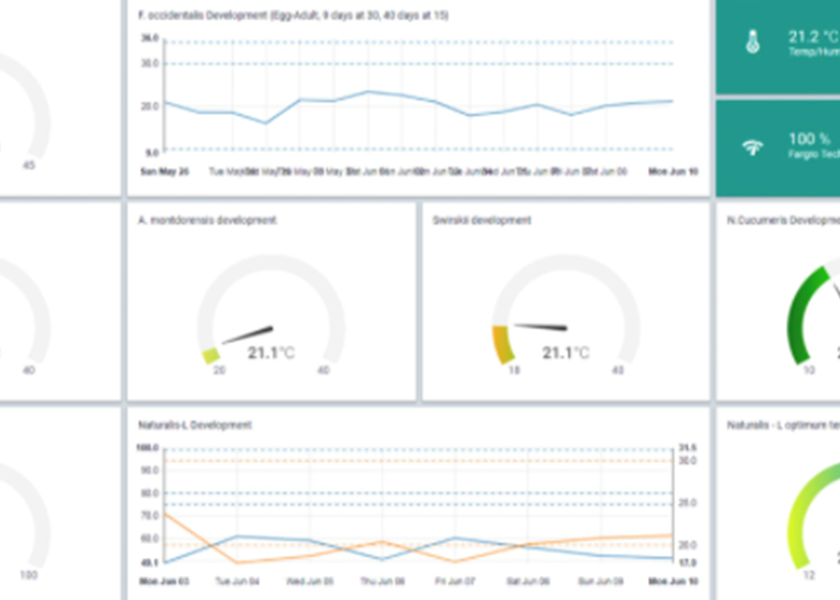
To take this one step further the visualisation of this data needs to instantly convey this information. By displaying real-time, 24 hour and data trends growers can confidently make an informed decision. The below example visualises the differing optimum conditions for each nematode as gauges that change colour based on efficacy at a given temperature. This gives an instantaneous view of which product will offer the best control and ultimately be the most cost-effective.
![30MHz ZENSIE dashboard [1]](/media/nqnb4twi/30mhzgraph2.jpg?anchor=center&mode=crop&width=840&height=600&rnd=132606238760870000)
The above example outlines different developmental bands on a line graph. From this, we as an advisor can better understand at the current point in time which pest the environmental conditions will favour and therefore alter our biological control programmes and potentially rotational sprays of biopesticides accordingly.
Further to this take for example growing degree models for the first flight of thrips. We could use this to inform decisions made by a grower and an advisor on when to start applications when to increase rates or even when to start looking to alter the makeup of the application dependant on which life cycle stage each bio is most effective at. Or as below, again make use of gauge widgets to suggest which control will work best at a given point in time.
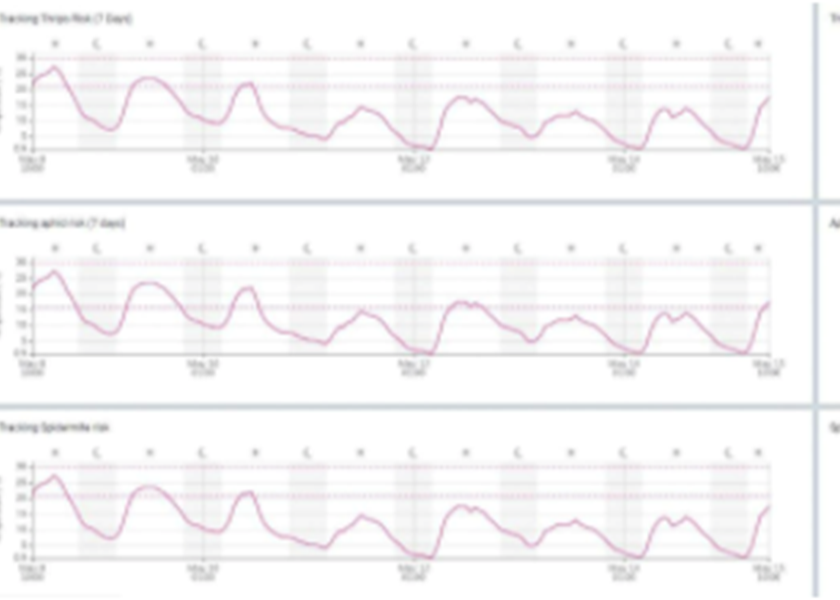
Data can also be used to optimise preventative controls for disease and the timing of applications of biopesticides for said diseases. For example, we have seen growers monitor humidity, airflow, leaf wetness etc and from this alter practices to decrease the potential risk from botrytis and downy mildew. Tracking graphs are useful to outline the time period of risk and then from this make a more informed decision on what product to apply based on risk. For example, in times of low pressure rotating between more preventive/early curative products like Taegro and Romeo or at times of high risk using more curative conventional chemistry. This can help to reduce chemical inputs which will reduce residues but also help maintain the efficacy of the remaining chemistry.
For more product information and to find out how you could use data to optimise your IPM programme, please contact us at

